Insights
Explore the Webrepublic universe at a glance: expert insights, trend analysis, behind-the-scenes moments, and the latest updates.
Spotlight
Subscribe to our newsletter and gain exciting insights into current marketing topics and industry news.
Latest insights
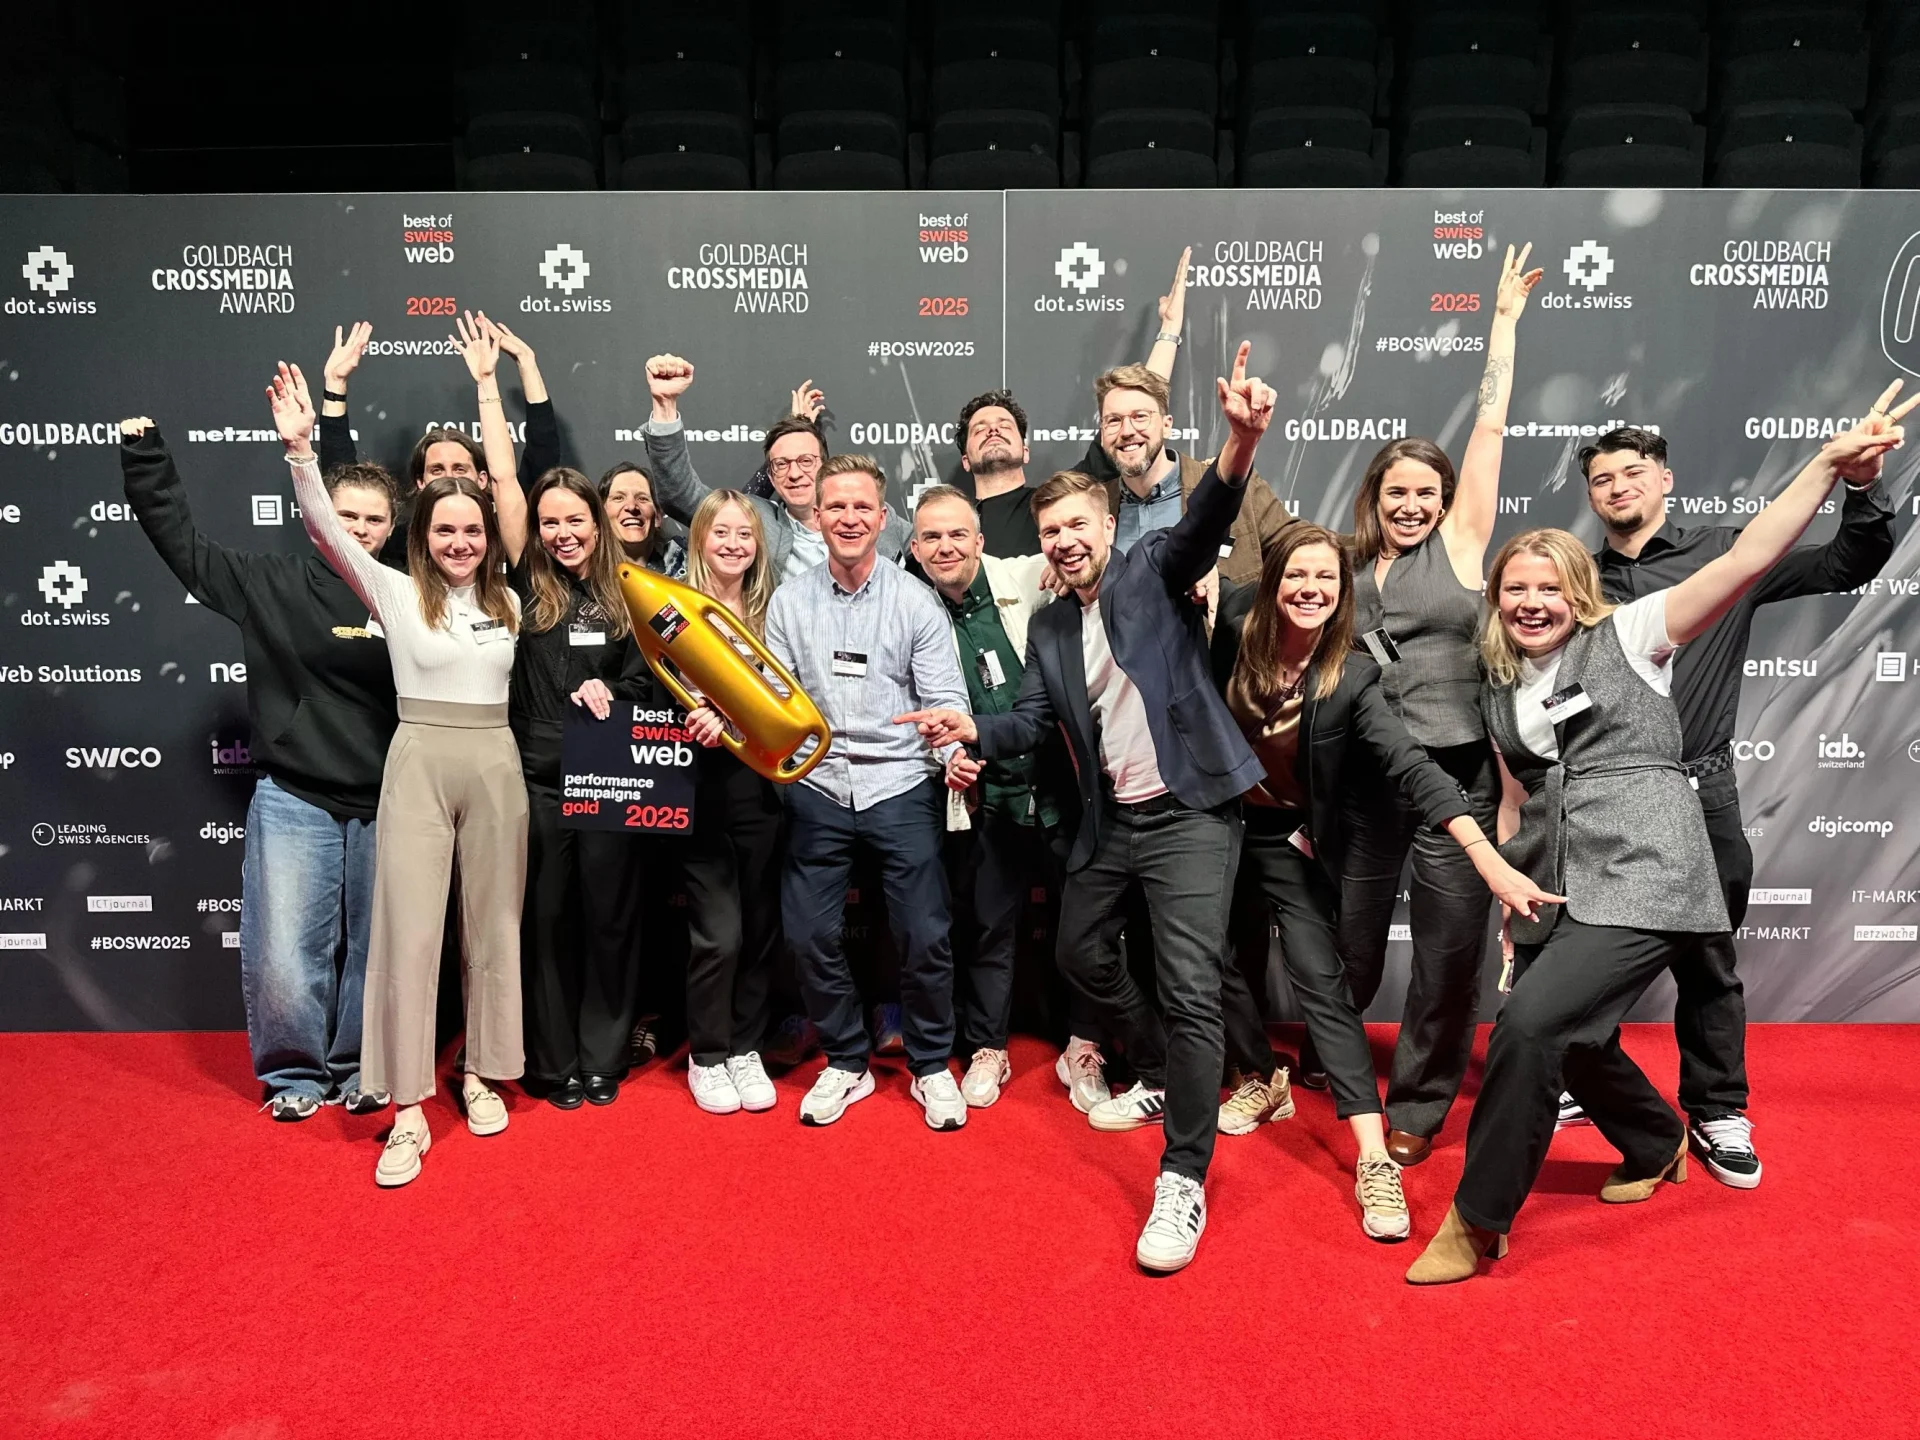

Best of Swiss Web Award 2024: Webrepublic Wins 6 Awards with CSS Versicherung and Migros
Focus on Effectiveness: How Google Performance Max Campaigns Are Revolutionizing Online Marketing
Increase Your Marketing Success with Digital Marketing Maturity
Switzerland’s Act on Federal Data Protection (FADP): What You Need to Know
YouTube and Connected TV: Why and How TV Advertising Needs to Be Rethought
The only marketing newsletter you’ll ever need
- Stay up-to-date with the latest industry news and trends.
- Get inspiring insights into current marketing topics.